What does an Insulin Effect Graph Show?
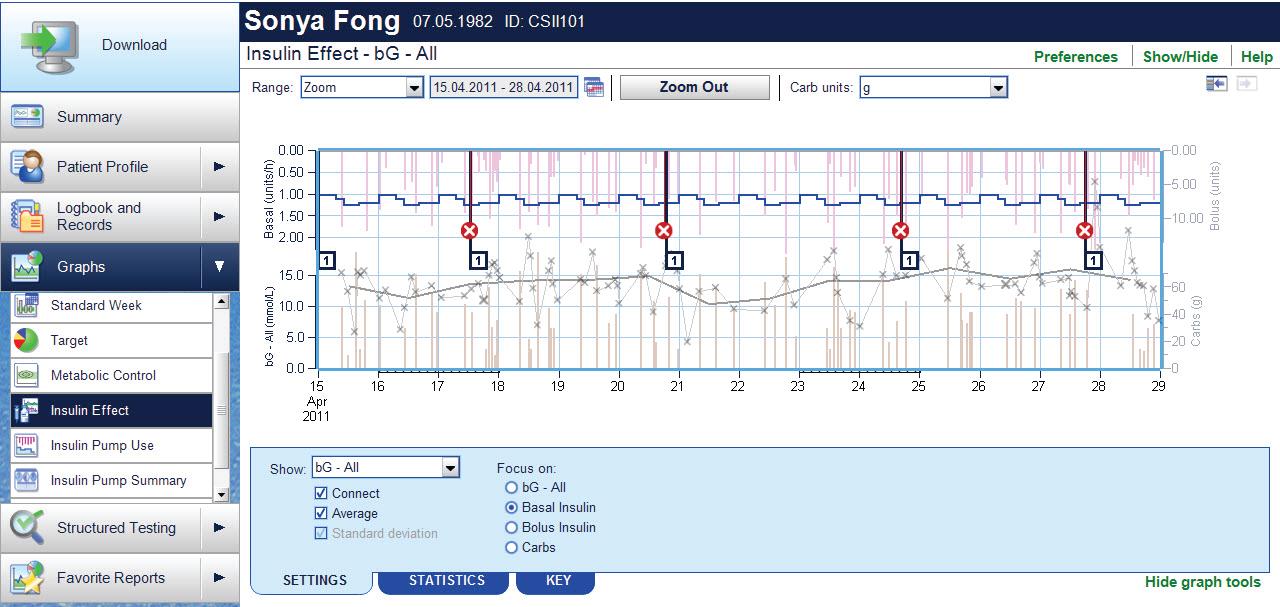
The Insulin Effect graph displays your information across time. The display indicates all the tests performed during the selected date range. The selected blood glucose parameter is graphed against Insulin and Carbohydrates. Bolus and basal Insulin are displayed in the upper half of the graph.
How can using the Insulin Effect Graph help improve the way you feel?
The information derived from the insulin effect graph allows you to view your blood glucose values in comparison to your carbohydrate and insulin intake. This information allows you to see if any modifications are required in your therapy or if there are any lifestyle choices that you may need to highlight to your healthcare professional team.
How often should I review my Insulin Effect Graph?
- Chart your blood glucose results every few days or every week to stay on top of your blood glucose control.
- Before any appointment with a healthcare professional, create a chart showing your blood glucose levels, insulin and carb intake over the few days prior. Discuss whether the variation you see is healthy, or whether you should take steps to even your levels out.