Identify peaks or patterns in your blood glucose levels as they relate to food and medication over a set of period of time, or according to the criteria most important to you.
What does the Trend Graph show?
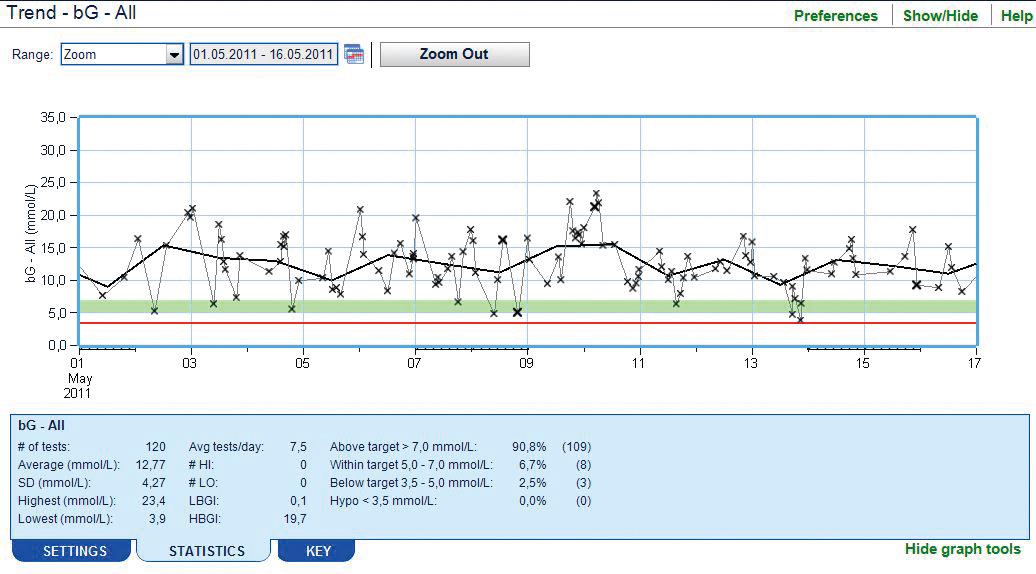
- A graphic representation of how your blood glucose reacts to food, medication and exercise. The Trend Graph lets you see how often - and how far - your blood glucose is out of the ranges recommended by your healthcare team.
- You can easily see if your blood glucose has dipped below your hypoglycaemic (i.e. Low blood glucose level) limit.
- Customise to track how medication, certain foods or other factors affect your blood glucose.
How can using the Trend Graph help improve the way you feel?
Seeing information presented graphically can help you recognise out-of-range patterns and act on them. For example, if you notice high or low blood glucose levels at the same time on a few days, or at the same time each week work with your healthcare team to problem-solve.
These small steps may improve the way you feel today and help reduce the risk of long-term complications.
How often should I review my Trend Graph?
- Chart your blood glucose results every few days or every week to stay on top of your blood glucose control.
- Before any appointment with a healthcare professional, create a chart showing your blood glucose levels over the few days prior. Discuss whether the variation you see is healthy, or whether you should take steps to better manage your blood glucose levels.