hamburger overlay
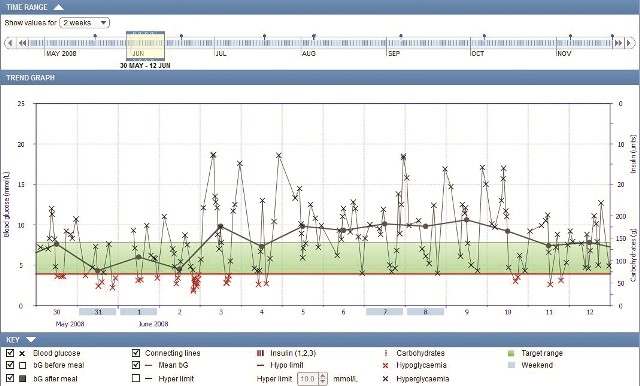
- The Trend Graph charts how your blood glucose levels fluctuated in the period of time chosen. It also shows insulin and carb values if the details have been entered in the Accu-Chek Meter.
- It helps you to easily review how often and how far your blood glucose was out of target range (the green bar in the chart) and possible interactions with food eaten or insulin taken if recorded. Your improved understanding will then help you to look for causes which can then be discussed with your healthcare team.
User Login